pygmt.datasets.load_sample_data
- pygmt.datasets.load_sample_data(name)[source]
Load an example dataset from the GMT server.
The data are downloaded to a cache directory (usually
~/.gmt/cache) the first time you invoke this function. Afterwards, it will load the data from the cache. So you’ll need an internet connection the first time around.- Parameters:
name (
Literal['bathymetry','earth_relief_holes','fractures','hotspots','japan_quakes','mars_shape','maunaloa_co2','notre_dame_topography','ocean_ridge_points','rock_compositions','usgs_quakes']) – Name of the dataset to load.- Return type:
- Returns:
data – Sample dataset loaded as a
pandas.DataFramefor tabular data orxarray.DataArrayfor raster data.
See also
list_sample_dataReport datasets available for tests and documentation examples.
Examples
>>> from pprint import pprint
>>> from pygmt.datasets import list_sample_data, load_sample_data
>>> # use list_sample_data to see the available datasets
>>> pprint(list_sample_data(), width=120)
{'bathymetry': 'Table of ship bathymetric observations off Baja California',
 'earth_relief_holes': 'Regional 20 arc-minutes Earth relief grid with holes',
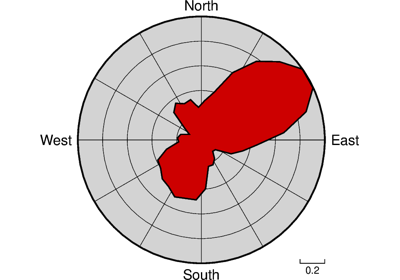
 'fractures': 'Table of hypothetical fracture lengths and azimuths',
 'hotspots': 'Table of locations, names, and symbol sizes of hotpots from Müller et al. (1993)',
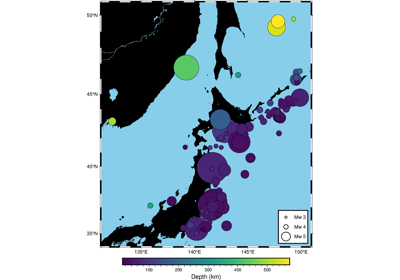
 'japan_quakes': 'Table of earthquakes around Japan from the NOAA NGDC database',
 'mars_shape': 'Table of topographic signature of the hemispheric dichotomy of Mars from Smith and Zuber (1996)',
 'maunaloa_co2': 'Table of CO2 readings from Mauna Loa',
 'notre_dame_topography': 'Table 5.11 in Davis: Statistics and Data Analysis in Geology',
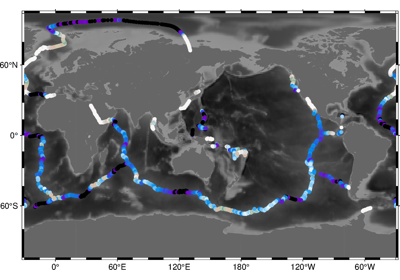
 'ocean_ridge_points': 'Table of ocean ridge points for the entire world',
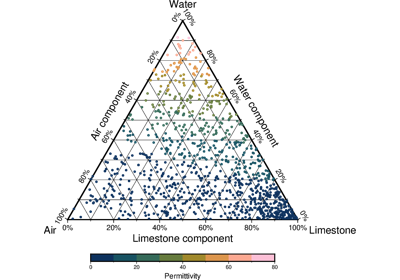
 'rock_compositions': 'Table of rock sample compositions',
 'usgs_quakes': 'Table of earthquakes from the USGS'}
>>> # Load the sample bathymetry dataset
>>> data = load_sample_data("bathymetry")
Examples using pygmt.datasets.load_sample_data
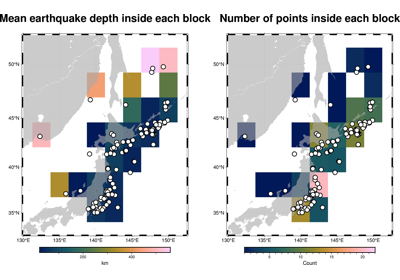
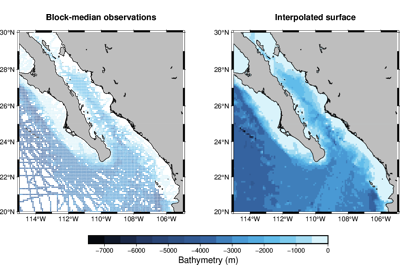
Gridding scattered data with blockmedian and surface
Gridding scattered data with blockmedian and surface